Here are some cool images generated by ORA!
Add your own images generated by ORA to our gallery by emailing them to images@netanomics.com.
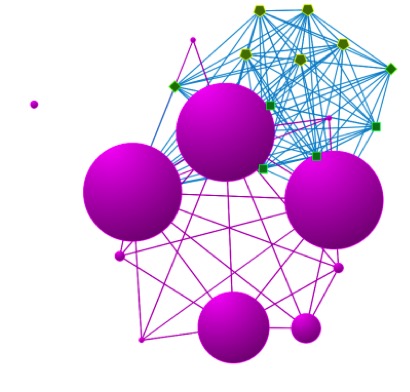
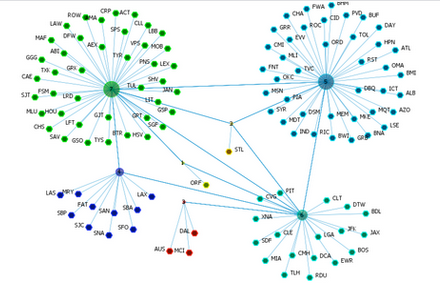
ORA network visualization supports seeing meta-nodes and individual nodes at the same time
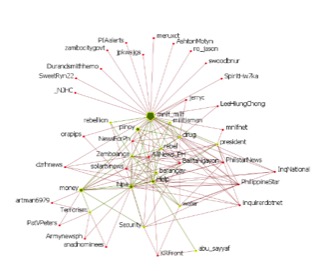
ORA’s two mode network visualization engine supports coloring and sizing nodes by attributes or metrics
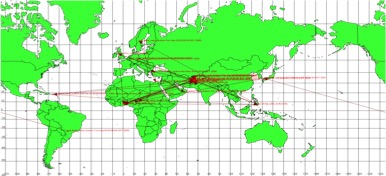
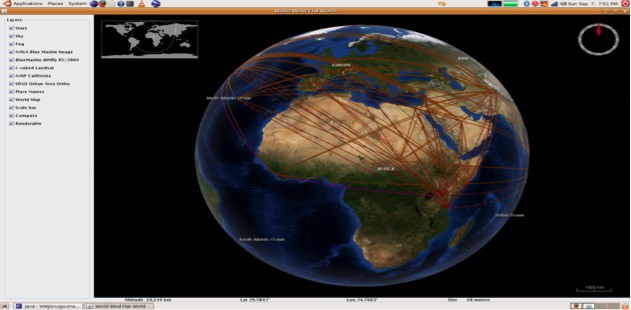
The movement of an actor moving across the globe is shown in this geo-temporal network visualization
Screenshot of ORA’s geospatial network visualization tool showing a network on a 3D map of the world.
ORA network visualization of meta-nodes. A meta-node is a node composed of other nodes.
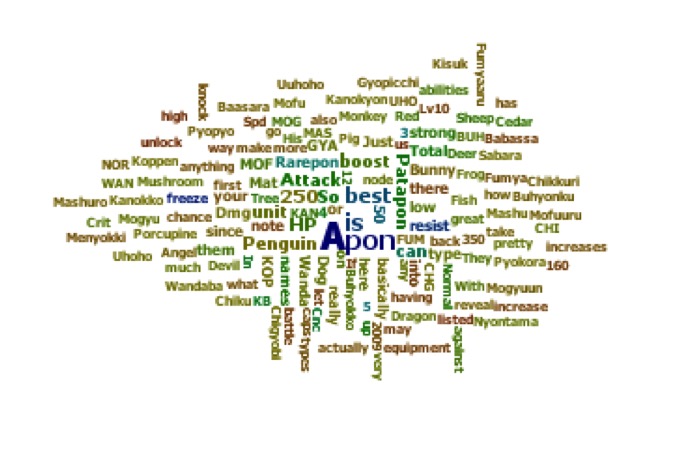
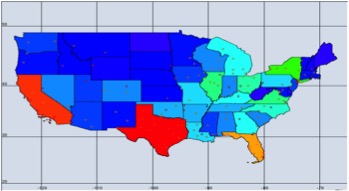
ORA network visualization in which network attributes are used to color a heatmap.
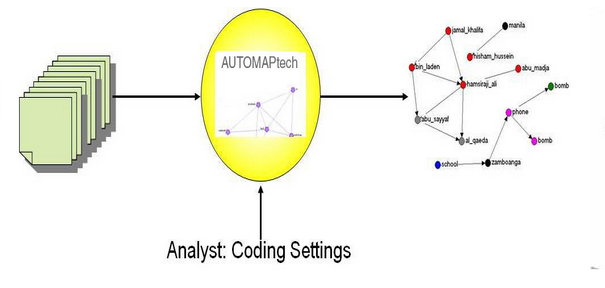
ORA network visualization in which group nodes are surrounded by their members nodes and all nodes are colored by group.